
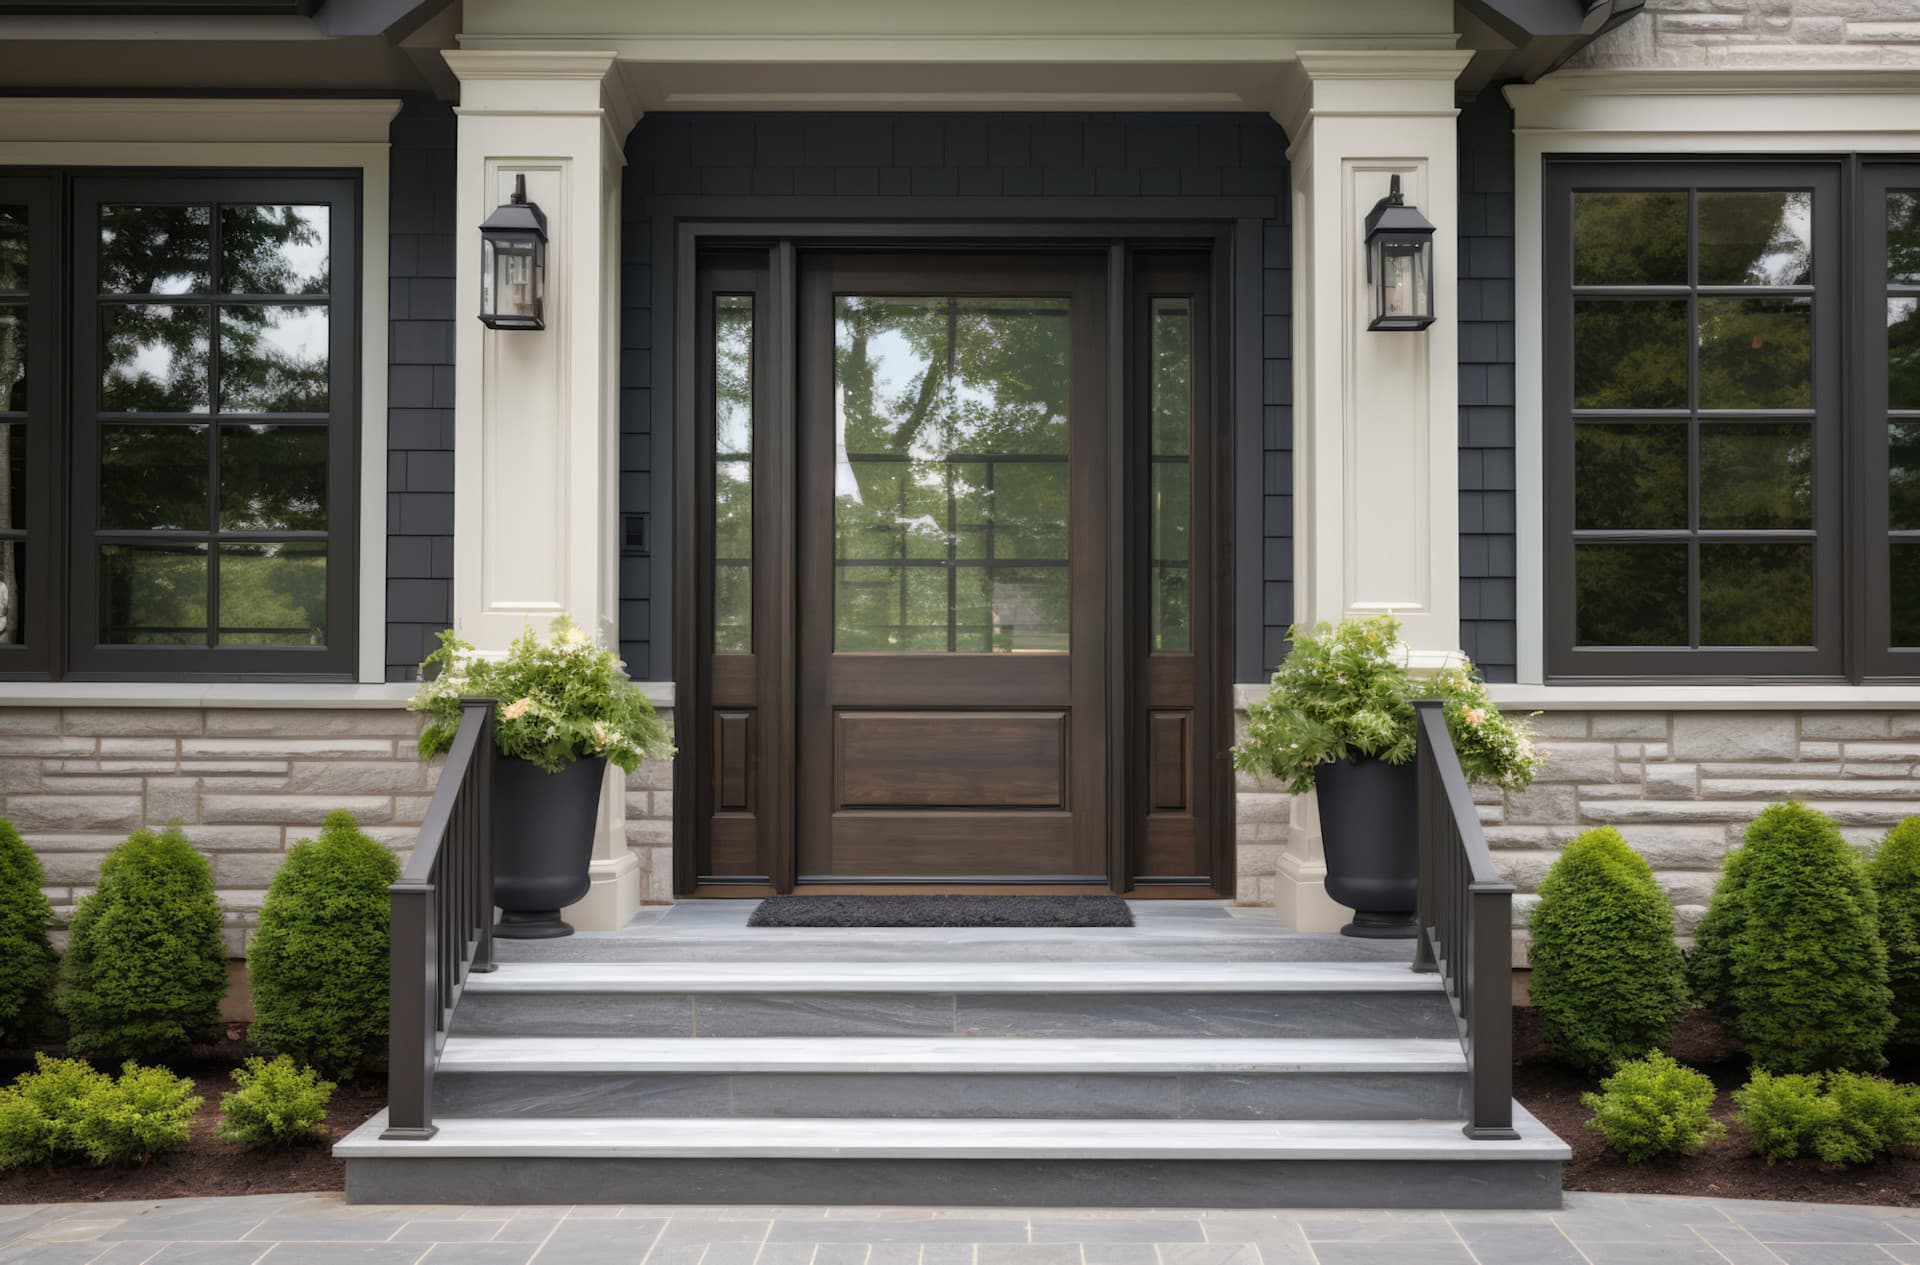
Rising home prices and increasing inventory, paired with mixed sales activity, suggest the regional housing market is gradually moving toward more balanced conditions. Here is a report by region of home sales during March of 2026:
Cincinnati Market Statistics
March 2026 vs March 2025
-0.6% decrease in homes sold (1,347)
+9.7% increase in median sale price ($317,000)
+2.1% increase in sales volume ($500,110,000)
+25.3% increase in active inventory (2,525 listings)
+4.7% increase in new listings (2,191 new listings)
+50.0% increase in median days on market (6 days)
January-March 2026 vs. January-March 2025
-1.9% decrease in homes sold (3,462 vs. 3,395)
+7.0% increase in median sale price ($285,000 vs. $305,000)
-0.1% decrease in sales volume ($1,220,000,000 vs. $1,210,000,000)
Statistics courtesy of Realtor® Alliance of Greater Cincinnati Home Sales Report
Northern Kentucky Market Statistics
March 2026 vs March 2025
-4.7% decrease in homes sold (457 homes vs 476 homes)
+2.4% increase in median sale price ($307,148 vs $300,000)
-1.0% decrease in sales volume ($165,000,000 vs $167,000,000)
+0.6% increase in active inventory (876 vs 871)
+1.0% increase in new listings (714 vs 707)
-10.4% decrease in average days on the market (43 vs 48)
January-March 2026 vs. January-March 2025
-5.3% decrease in homes sold (1,192 vs. 1,259)
-2.2% decrease in median sale price ($293,550 vs. $300,000)
-6.9% decrease in sales volume ($405,000,000 vs. $435,000,000)
Statistics courtesy of N. Kentucky Association of Realtors® Sales Report
Dayton Market Statistics
March 2026 vs March 2025
+7.99% increase in homes sold (1,163 vs 1,077)
+8.33% increase in median sale price ($260,000 vs $240,000)
+11.97% increase in sales volume ($340,541,620 vs $304,146,157)
+8.98% increase in new listings (1,614 vs 1,481)
January-March 2026 vs January-March 2025
+4.09% increase in homes sold (2,900 vs 2,786)
+8.36% increase in median sale price ($254,650 vs $235,000)
+7.85% increase in sales volume ($828,995,816 vs $768,655,256)
+4.70% increase in new listings (3,857 vs 3,684)
Statistics courtesy of Dayton Realtors Home Sales Report